EX-99.2
Published on November 4, 2009

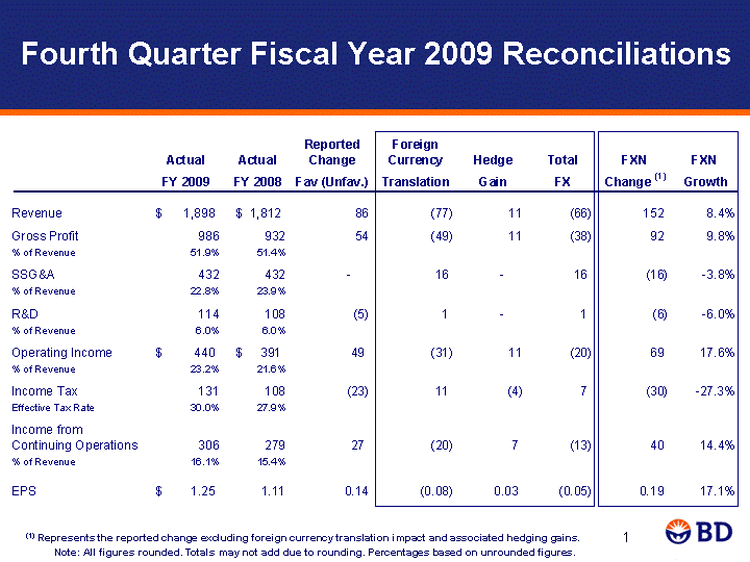
| Fourth Quarter Fiscal Year 2009 Reconciliations (1) Represents the reported change excluding foreign currency translation impact and associated hedging gains. Note: All figures rounded. Totals may not add due to rounding. Percentages based on unrounded figures. Fourth Quarter Fiscal Year 2009 Reconciliations Actual Actual Reported Change Foreign Currency Hedge Total FXN FXN FY 2009 FY 2008 Fav (Unfav.) Translation Gain FX Change (1) Growth Revenue 1,898 $ 1,812 $ 86 (77) 11 (66) 152 8.4% Gross Profit 986 932 54 ( 49) 11 ( 38) 92 9.8% ) ) % of Revenue 51.9% 51.4% SSGandA 432 432 - 16 - 16 (16) -3.8% % of Revenue 22.8% 23.9% RandD 114 108 (5) 1 - 1 (6) -6.0% % of Revenue 6.0% 6.0% Operating Income 440 $ 391 $ 49 (31) 11 (20) 69 17.6% % of Revenue 23.2% 21.6% Income Tax 131 108 (23) 11 (4) 7 (30) -27.3% Effective Tax Rate 30.0% 27.9% Income from Continuing Operations 306 279 27 (20) 7 (13) 40 14.4% % of Revenue 16.1% 15.4% 1 (1) Represents the reported change excluding foreign currency translation impact and associated hedging gains. EPS 1.25 $ 1.11 0.14 (0.08) 0.03 (0.05) 0.19 17.1% Note: All figures rounded. Totals may not add due to rounding. Percentages based on unrounded figures. |

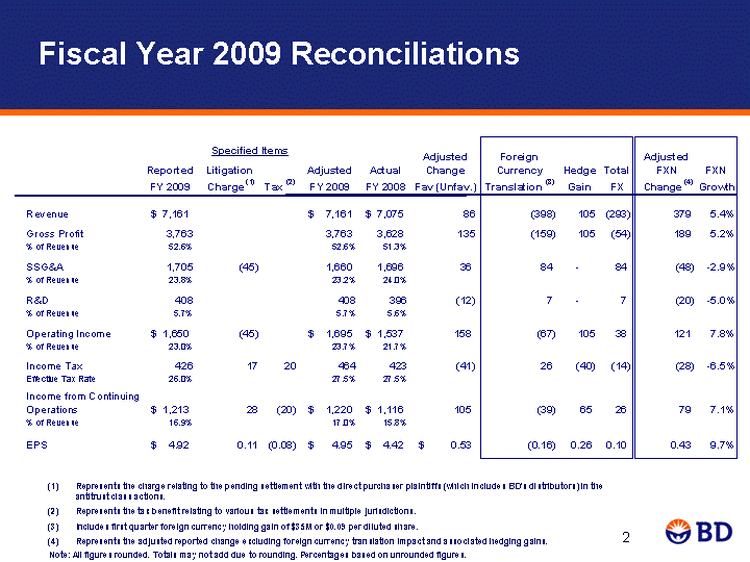
| Fiscal Year 2009 Reconciliations Represents the charge relating to the pending settlement with the direct purchaser plaintiffs (which includes BD's distributors) in the antitrust class actions. Represents the tax benefit relating to various tax settlements in multiple jurisdictions. Includes first quarter foreign currency holding gain of $35M or $0.09 per diluted share. Represents the adjusted reported change excluding foreign currency translation impact and associated hedging gains. Specified Items Note: All figures rounded. Totals may not add due to rounding. Percentages based on unrounded figures. Fiscal Year 2009 Reconciliations Specified Items Adjusted Foreign Adjusted Reported Litigation Adjusted Actual j Change g Currency Hedge Total j FXN FXN FY 2009 Charge (1) Tax (2) FY 2009 FY 2008 Fav (Unfav.) Translation (3) Gain FX Change (4) Growth Revenue 7,161 $ 7,161 $ 7,075 $ 86 (398) 105 (293) 379 5.4% Gross Profit 3,763 3,763 3,628 135 (159) 105 (54) 189 5.2% % of Revenue 52.6% 52.6% 51.3% SSGandA 1,705 (45) 1,660 1,696 36 84 - 84 (48) -2.9% % of Revenue 23.8% 23.2% 24.0% RandD 408 408 396 (12) 7 - 7 (20) -5.0% % of Revenue 5.7% 5.7% 5.6% Operating Income 1,650 $ (45) 1,695 $ 1,537 $ 158 (67) 105 38 121 7.8% % of Revenue 23.0% 23.7% 21.7% Income Tax 426 17 20 464 423 (41) 26 (40) (14) (28) -6.5% Effective Tax Rate 26.0% 27.5% 27.5% Income from Continuing Operations 1,213 $ 28 (20) 1,220 $ 1,116 $ 105 (39) 65 26 79 7.1% % of Revenue 16.9% 17.0% 15.8% EPS 4.92 $ 0.11 (0.08) 4.95 $ 4.42 $ 0.53 $ (0.16) 0.26 0.10 0.43 9.7% 2 |